7.4. Manufacturing emissions
Due to their batteries, BEVs have more embedded carbon in the manufacturing process. Here we calculate the mileage needed in order for BEVs to be less carbon intensive than ICE vehicles.
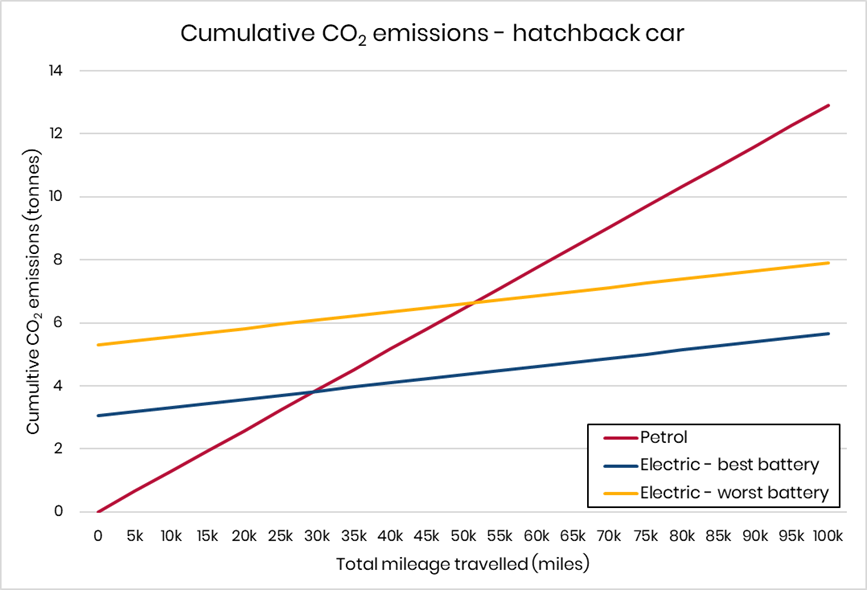
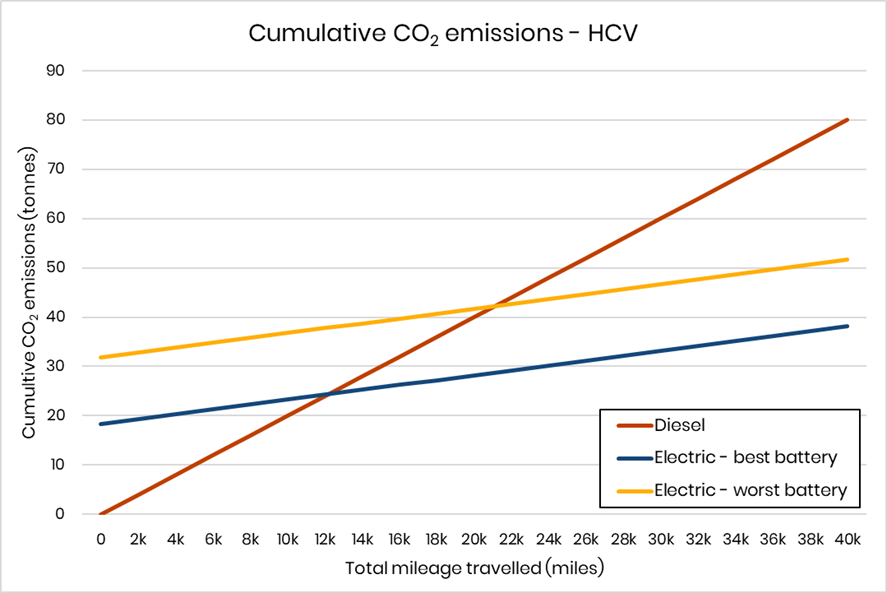
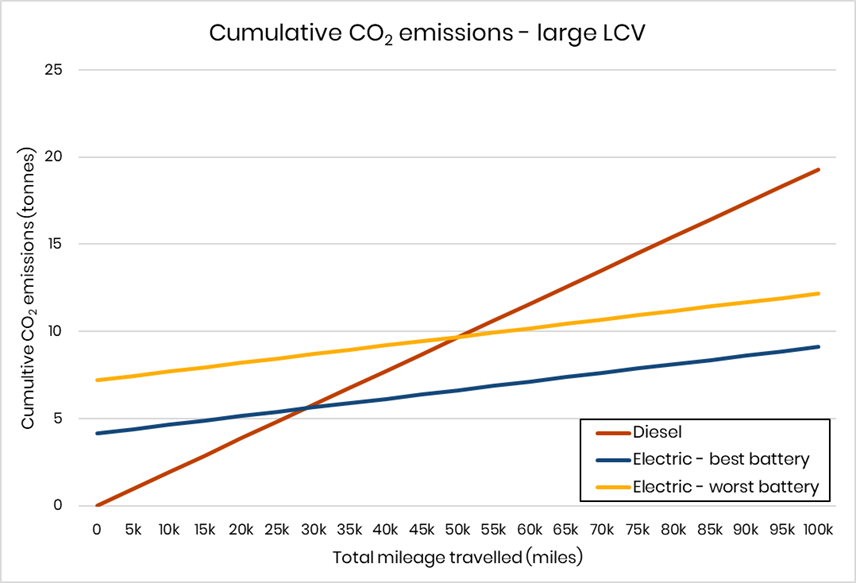
Although BEVs produce no tailpipe emissions, they do produce emissions from the electricity production, and from manufacturing the batteries. Because ICE vehicles produce much more emissions when in use however, over the lifetime of the vehicle a BEV will produce fewer emissions than the ICE counterpart. The three following graphs show the mileage at which the ICE vehicle will produce more lifetime emissions.
We have included both best and worst case current batteries in these graphs. As electricity grids clean up and battery production improves, the emissions of battery production and electric vehicles in use will both reduce further. We have also not included any other manufacturing processes, such as catalytic converters in ICE vehicles, which also use rare earth materials.
In the case of cars and vans, the best battery breaks even at around 27 thousand miles (within 3 years at 10,000 miles a year). For the HCV the breakeven point is around 12 thousand miles. This is also based on UK average grid electricity for 2024, as the grid further decarbonises, BEV emissions will further reduce. In general, vehicles which are manufactured in Europe (including the battery) achieve ‘best battery’ emissions.
-
ICE vehicle carbon intensity – WLTP average for vehicle, from manufacturer (WLTP) or estimated (HCVs).
Vehicle energy efficiency – WLTP average for vehicle, from manufacturer (WLTP) or estimated (HCVs).
UK grid carbon intensity – 124 gCO2/kWh
Battery emissions – best – 61 kgCO2e/kWh
Battery emissions – worst – 106 kgCO2e/kWh