 Return home
Return home
Return homeExplore a typical grey fleet and discover how grey fleet reliance can be reduced by shifting journeys up the sustainable transport hierarchy to shared car use or public transport.
In a typical grey fleet, a relatively small number of drivers account for a large proportion of total business mileage.
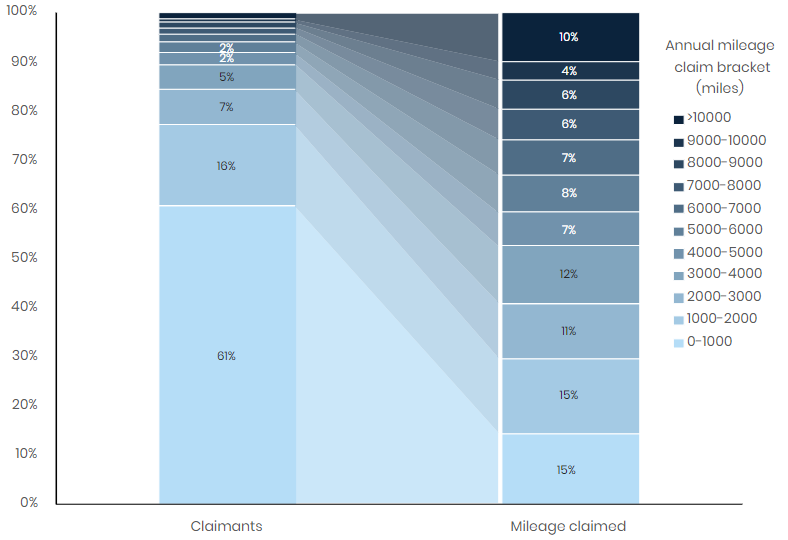
The example grey fleet shown in Figure 16 includes 2,506 claimants covering just over 3.8 million miles each year. While this equates to an average of 1,540 miles per claimant, mileage is not evenly distributed. The graph below shows that 61% of grey fleet drivers claim between 0 and 1,000 miles annually, yet account for only 15% of the total mileage claimed.
At the other end of the scale, just 1.2% of drivers account for almost 10% of total mileage claims. Each of these drivers claims more than 10,000 miles per year. This pattern is typical of many grey fleets. In this example, a driver claiming the average annual mileage of 1,540 miles would receive £693 in mileage reimbursement*. However, the highest-mileage claimant, travelling more than 17,000 miles annually, could receive up to £7,732*.
*Assuming a reimbursement rate of 45p per mile.
Using the average emissions factor for cars on UK roads in 2021 (171.48gCO2e/km) (DBEIS, 2021), the total CO2e emissions associated with this grey fleet would be approximately 473 tonnes.
You can reduce reliance on the grey fleet by encouraging journeys further up the sustainable transport hierarchy, such as public transport, car sharing and shared vehicle use. Organisations that target interventions at the highest-mileage claimants can achieve significant reductions in both costs and CO2e emissions. These savings can then be reinvested in fleet decarbonisation initiatives.
Figure 16: Graphic display of a typical local authority grey fleet claimant profile